Use the Pandas String-Only get_dummies Method to Instantly Restructure your Data

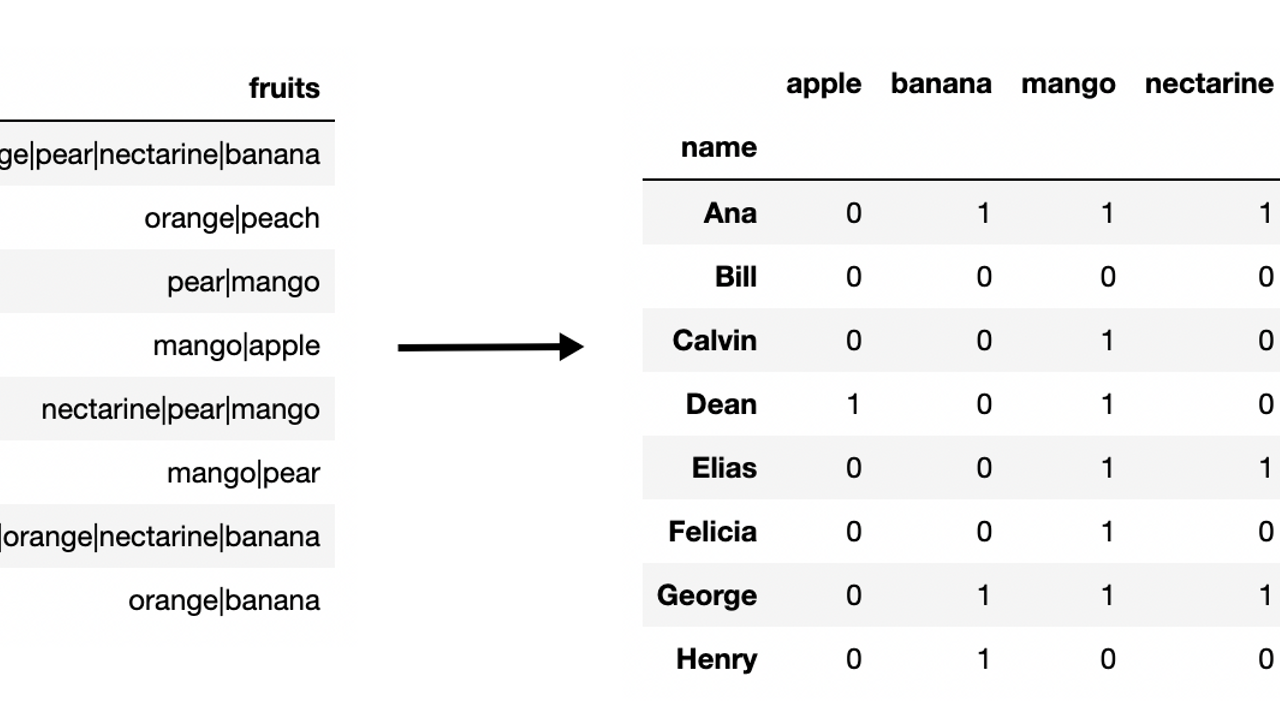
In this post, you'll learn how to use the fantastic str.get_dummies Pandas Series method to instantly restructure trapped data within a string. We begin by reading in a small sample dataset containing people's favorite fruits.
import pandas as pd
df = pd.read_csv('data/fruits.csv')
df
| name | fruits | |
|---|---|---|
| 0 | Ana | mango|orange|pear|nectarine|banana |
| 1 | Bill | orange|peach |
| 2 | Calvin | pear|mango |
| 3 | Dean | mango|apple |
| 4 | Elias | nectarine|pear|mango |
| 5 | Felicia | mango|pear |
| 6 | George | mango|pear|orange|nectarine|banana |
| 7 | Henry | orange|banana |
Notice that the fruit column has multiple fruit names in each cell separated by a pipe character. While this format compactly represents the data, it isn't the most suitable for answering basic questions such as:
- What is the number of fruit per person?
- How many people enjoy banana?
- Which people enjoy both oranges and bananas?
- How any fruits are in-common with each person?
Attempt to answer questions in current form
It's possible to answer these questions in the current format using Pandas, though, we will see how these ways are sub-optimal. Here we find the number of fruit per person by adding one to the count of the pipe characters.
s = df.set_index('name')['fruits']
s.str.count(r'\|') + 1
name
Ana        5
Bill       2
Calvin     2
Dean       2
Elias      3
Felicia    2
George     5
Henry      2
Name: fruits, dtype: int64
The number of people who enjoy banana.
s.str.contains('banana').sum()
3
The people that enjoy both oranges and banana.
s.str.contains('(?=.*orange)(?=.*banana)')
name
Ana         True
Bill       False
Calvin     False
Dean       False
Elias      False
Felicia    False
George      True
Henry       True
Name: fruits, dtype: bool
Finding the number of fruits in-common with both people is particularly difficult and is a clear case for reformatting the data.
Better formatting of the data
All of these questions can be bettered answered if the data is in a different format. The get_dummies string-only method will split all values in a single cell into their own columns creating 0/1 indicator variables. Here, we pass in the pipe character to get_dummies, producing the following DataFrame.
df1 = s.str.get_dummies('|')
df1
| apple | banana | mango | nectarine | orange | peach | pear | |
|---|---|---|---|---|---|---|---|
| name | |||||||
| Ana | 0 | 1 | 1 | 1 | 1 | 0 | 1 |
| Bill | 0 | 0 | 0 | 0 | 1 | 1 | 0 |
| Calvin | 0 | 0 | 1 | 0 | 0 | 0 | 1 |
| Dean | 1 | 0 | 1 | 0 | 0 | 0 | 0 |
| Elias | 0 | 0 | 1 | 1 | 0 | 0 | 1 |
| Felicia | 0 | 0 | 1 | 0 | 0 | 0 | 1 |
| George | 0 | 1 | 1 | 1 | 1 | 0 | 1 |
| Henry | 0 | 1 | 0 | 0 | 1 | 0 | 0 |
We can now answer the same questions as before. Here, we count the number of fruit for each person.
df1.sum(axis=1)
name
Ana        5
Bill       2
Calvin     2
Dean       2
Elias      3
Felicia    2
George     5
Henry      2
dtype: int64
We sum up a single column to count the total number of people who enjoy bananas.
df1['banana'].sum()
3
Here, we use the query method to select each person who likes both oranges and bananas.
df1.query('orange + banana == 2')
| apple | banana | mango | nectarine | orange | peach | pear | |
|---|---|---|---|---|---|---|---|
| name | |||||||
| Ana | 0 | 1 | 1 | 1 | 1 | 0 | 1 |
| George | 0 | 1 | 1 | 1 | 1 | 0 | 1 |
| Henry | 0 | 1 | 0 | 0 | 1 | 0 | 0 |
Finding the number of fruits in-common with each person is where the largest gain from restructuring comes from. Here, we use the matrix multiplication operator to multiply the DataFrame to itself.
df1 @ df1.T
| name | Ana | Bill | Calvin | Dean | Elias | Felicia | George | Henry |
|---|---|---|---|---|---|---|---|---|
| name | ||||||||
| Ana | 5 | 1 | 2 | 1 | 3 | 2 | 5 | 2 |
| Bill | 1 | 2 | 0 | 0 | 0 | 0 | 1 | 1 |
| Calvin | 2 | 0 | 2 | 1 | 2 | 2 | 2 | 0 |
| Dean | 1 | 0 | 1 | 2 | 1 | 1 | 1 | 0 |
| Elias | 3 | 0 | 2 | 1 | 3 | 2 | 3 | 0 |
| Felicia | 2 | 0 | 2 | 1 | 2 | 2 | 2 | 0 |
| George | 5 | 1 | 2 | 1 | 3 | 2 | 5 | 2 |
| Henry | 2 | 1 | 0 | 0 | 0 | 0 | 2 | 2 |
Master Data Analysis with Python
If you enjoyed this tip and area looking to become an expert with Pandas, then check out my extremely comprehensive book, Master Data Analysis with Python. It is the most comprehensive Pandas book available, comes with 500+ exercises, video tutorials, and certification exams.

