Dunder Data Challenge #1 - Optimize Custom Grouping Function
This is the first edition of the Dunder Data Challenge series designed to help you learn python, data science, and machine learning. Begin working on any of the challenges directly in a Jupyter Notebook thanks to Binder (mybinder.org).
In this challenge, your goal is to find the fastest solution while only using the Pandas library.
Begin Mastering Data Science Now for Free!
Take my free Intro to Pandas course to begin your journey mastering data analysis with Python.
The Challenge
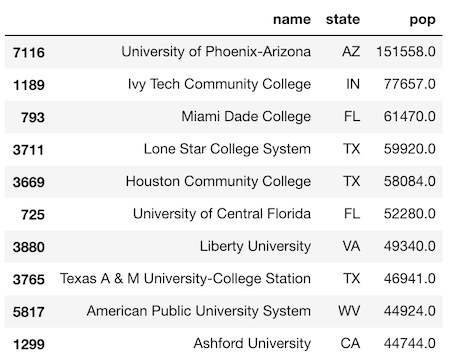
The college_pop dataset contains the name, state, and population of all higher-ed institutions in the US and its territories. For each state, find the percentage of the total state population made up by the 5 largest colleges of that state. Below, you can inspect the first few rows of the data.
>>> import pandas as pd
>>> college = pd.read_csv('data/college_pop.csv')
>>> college.head()

Solutions
Stop here if you want to attempt to answer this challenge on your own.
A grouping problem
This problem needs the use of the groupby method to group all the colleges by state. With each group, we need to do these 4 steps:
- Select the top 5 largest schools
- Sum the population of these 5 largest schools
- Sum the entire state population
- Divide the results of step 2 and 3
Pandas groupby objects have many methods such as min, max, mean, sum, etc… There is no direct method to accomplish our current task. We will need to do this problem in steps. There are multiple different approaches to solve this challenge which are outlined below.
Solution 1: Naive Custom Function
Many Pandas users will see a problem like this and immediately think about creating a custom grouping function. Let’s start with this approach. Below, we create a custom function that accepts a single column and returns a single value. We will sort this column from greatest to least and then finish the problem.
def find_top_5(s):
    s = s.sort_values(ascending=False)
    top5 = s.iloc[:5]
    top5_total = top5.sum()
    total = s.sum()
    return  top5_total / total
Let’s use this custom function to get our result.
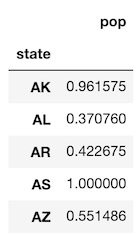
>>> result = college.groupby('state').agg({'pop': find_top_5})
>>> result.head()

Inspecting the custom function
It can be difficult to understand the operations taking place within custom grouping functions. One way to track and debug the code within custom grouping functions is to output the results of the variable you would like to inspect. You can use the print function but I recommend using the display function from the IPython.display module. This will output DataFrames styled in the same manner as they would in the notebook. In this particular example, we will only output Series objects, but they are more useful for outputting DataFrames. Below, we define a new custom function that displays each line to the screen.
Note, that this function is actually called twice, which doesn’t seem to make any sense since an error is always raised before the function ends. Pandas always calls custom grouping functions twice for the first group regardless if it produces an error.
from IPython.display import displaydef find_top_5_display(s):
    s = s.sort_values(ascending=False)
    display('sorted schools', s)

    top5 = s.iloc[:5]
    display('top 5 schools', top5)

    top5_total = top5.sum()
    display('top 5 total', top5_total)

    total = s.sum()
    display('state total', total)

    answer = top5_total / total
    display('answer', answer)
    raise
Let’s call this new function to see the results of each line of code.
>>> college.groupby('state').agg({'pop': find_top_5_display})

'sorted schools'

60      12865.0
62       5536.0
66       3256.0
63       1428.0
65        889.0
67        479.0
64        275.0
5171      109.0
5417       68.0
61         27.0
Name: pop, dtype: float64

'top 5 schools'

60    12865.0
62     5536.0
66     3256.0
63     1428.0
65      889.0
Name: pop, dtype: float64

'top 5 total'

23974.0

'state total'

24932.0

'answer'

0.9615754853200706
If you are enjoying this article, consider purchasing the All Access Pass! which includes all my current and future material for one low price.
Solution 1 Performance
On my machine, this solution completes in about 50ms.
>>> %timeit -n 5 college.groupby('state').agg({'pop': find_top_5})
53.1 ms ± 2.26 ms per loop
Using apply instead of agg
You can use the apply method as well which has slightly different syntax and returns a Series and not a DataFrame. Performance is similar.
>>> %timeit -n 5 college.groupby('state')['pop'].apply(find_top_5)
58.8 ms ± 3.7 ms per loop
Solution 2: Sort all data first
Instead of sorting the data within the custom function, we can sort the entire DataFrame first. Pandas preserves the order of the rows within each group so we don’t need to worry about losing this sorted order during grouping. Below, we create a new custom function that assumes the data is already sorted. The result is the exact same as solution 1.
>>> cs = college.sort_values('pop', ascending=False)
>>> def find_top_5_sorted(s):
        top5 = s.iloc[:5]
        return top5.sum() / s.sum()
>>> cs.groupby('state').agg({'pop': find_top_5_sorted}).head()
Solution 2 Performance
On my machine, this performs twice as fast as solution 1.
>>> %timeit -n 5 cs.groupby('state').agg({'pop': find_top_5_sorted})
23.3 ms ± 1.2 ms per loop
Why the performance improvement?
One thing you must be aware of when using a custom grouping function is their potential for poor performance. Every line of code in the custom function must be re-run for each group. If you can apply a function to the entire DataFrame instead of within a custom function, you will almost always see a nice performance gain.
Solution 3: No custom function
It’s possible to eliminate the custom function entirely. Pandas groupby objects have a head method that returns the first values of each group. This eliminates the need to call s.iloc[:5] within the custom function. Let's see this portion now. Notice, we create a new variable grouped to reference the groupby object. We will use this again later.
>>> cs = college.sort_values('pop', ascending=False)
>>> grouped = cs.groupby('state')
>>> cs_top5 = grouped.head(5)
>>> cs_top5.head(10)

Only the first 5 rows for each state are returned. Let’s output the number of rows of this DataFrame below.
>>> cs_top5.shape(270, 5)
This dataset includes US territories which is why there are more than 250 rows (50 states * 5).
Perform another groupby
From here, we must perform another groupby on this smaller dataset to get the total for these top 5 schools.
>>> top5_total = cs_top5.groupby('state').agg({'pop': 'sum'})
>>> top5_total.head()

Now we find the total for all the schools in each state.
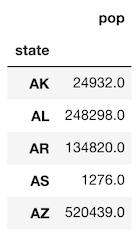
>>> total = grouped.agg({'pop': 'sum'})
>>> total.head()

Now, we can divide the previous two to get the desired result, which is the same as the previous two solutions.
>>> top5_total / total
Solution 3 Performance
Eliminating the custom function altogether gives us the best performance, about 7x faster on my machine than Solution 1.
>>> %%timeit -n 5
>>> cs = college.sort_values('pop', ascending=False)
>>> grouped = cs.groupby('state')
>>> cs_top5 = grouped.head(5)
>>> top5_total = cs_top5.groupby('state').agg({'pop': 'sum'})
>>> total = grouped.agg({'pop': 'sum'})
>>> answer = top5_total / total7.43 ms ± 665 µs per loop
Summary
Avoid custom grouping functions if possible
For complex grouping situations, you will be tempted to write your own custom function to do all of the work. This is dangerous and can lead to extremely inefficient code. Pandas cannot optimize custom functions. It has a limited number of builtin grouping methods. All of these are optimized and should yield better performance. The following are some guidelines when approaching a complex grouping situation.
Use a builtin grouping method if it exists
If a builtin grouping method exists then you should use it over any custom function.
Operate on the entire DataFrame if possible and not to individual groups
Solution 1 above was the slowest and performed all its calculations to each group within the custom function. This was the slowest solution. If you can perform an operation to the entire DataFrame outside of the custom grouping function, you will much better performance.
Optimizing Pandas Performance
In general, use builtin Pandas methods whenever they exist and avoid custom functions if at all possible. Solution 3 uses no custom functions and performs the best.
Master Python, Data Science and Machine Learning
Immerse yourself in my comprehensive path for mastering data science and machine learning with Python. Purchase the All Access Pass to get lifetime access to all current and future courses. Some of the courses it contains:
- Master the Fundamentals of Python— A comprehensive introduction to Python (300+ pages, 150+ exercises)
- Master Data Analysis with Python — The most comprehensive course available to learn pandas. (800+ pages and 500+ exercises)
- Master Machine Learning with Python — A deep dive into doing machine learning with scikit-learn constantly updated to showcase the latest and greatest tools. (300+ pages)

